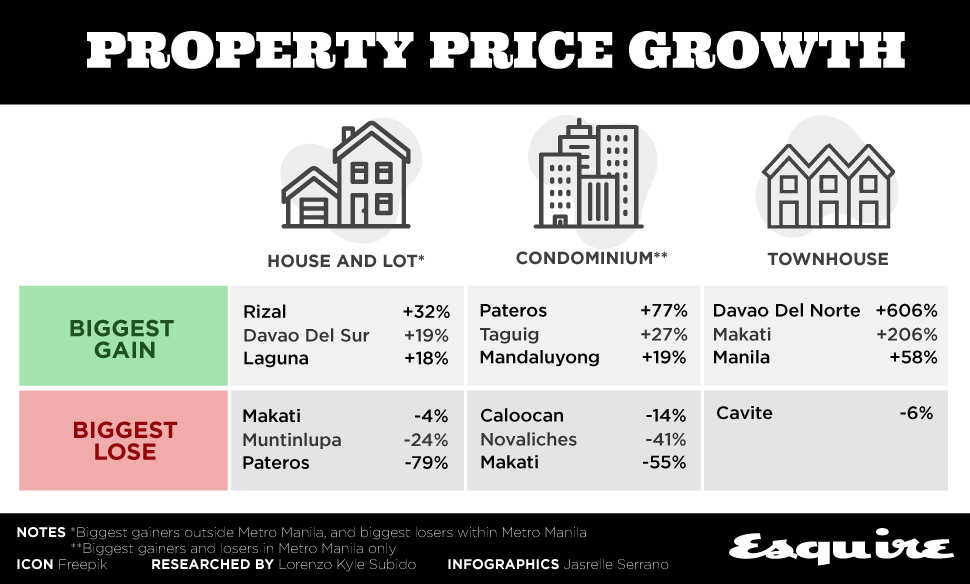
If you bought a house and lot in Rizal, a condominium unit in Pateros, or a townhouse in Davao Del Norte at the start of 2017, your property’s prices soared the highest in the last two years.
That’s according to data from Property24, an online real estate portal under the OLX Group. It released a study showing the average price increases of residential properties from January 2017 to October 2018, which it derived from various listings on the platform.
“Because of the numerous residential listings that we have on OLX and Property24, we have access to data that can help consumers make an informed decision if and when they decide to purchase and sell real estate properties,” said Tina Bautista, head of real estate in Property24, in a statement.

The data highlighted the price movements of three types of residential properties—house and lots, condominiums, and townhouses—across various areas around the Philippines. Property24 said that the increases and decreases in price were influenced by several factors such as supply and demand, economic growth, and inflation.
Among house and lots, Property24 revealed that those in Rizal experienced the largest price growth out of all areas outside of Metro Manila at 32 percent. In contrast, house and lots in Pateros saw the country’s largest drop in price at 79 percent in the period studied.
The large decline in values of house and lots in Pateros may be explained by the growing preference in condominium units in the area, as the city saw the highest price growth in residential condos in Metro Manila at 77 percent. On the other end of that spectrum is Makati City, whose condo prices experienced a 55-percent decline according to Property24’s data.
Townhouses seem to be the safest investments among the three, as Property24 revealed that only those in Cavite saw its prices decline in the period studied. However, these types of properties experienced the largest growths, as townhouses in Davao Del Norte and Makati City saw increases of 606 percent and 207 percent respectively.
ADVERTISEMENT – CONTINUE READING BELOW
Check out the infographic above to find out about the property price movements in other key areas of the country.
Source link
 DRIVE STARTUPS We Present Latest Startup News, Tips & Inspiration

